
Listen to this article
Checking audio support
The Order History Screen That Broke at 7 PM
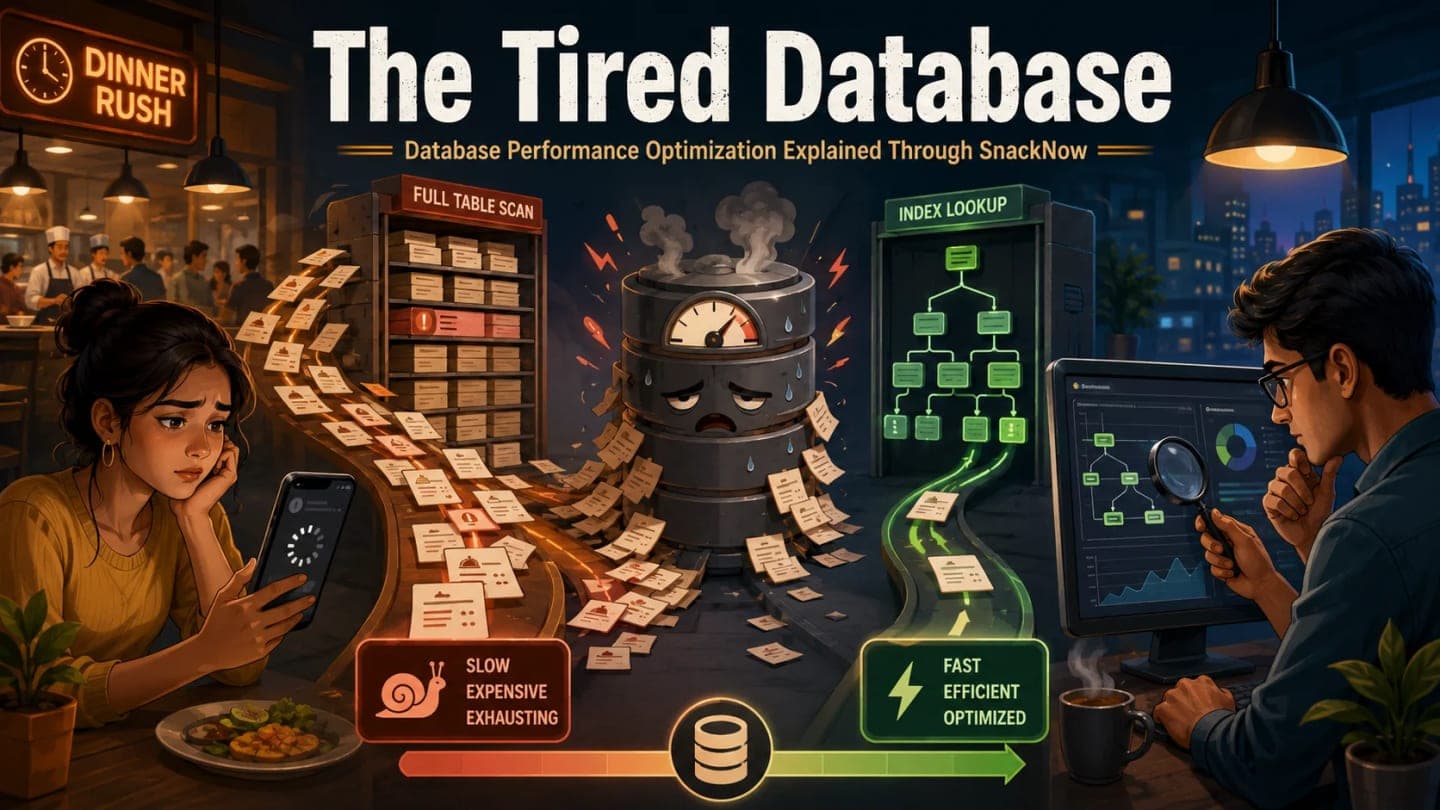
At 6:55 PM, SnackNow looks healthy. Riya opens her recent orders, the page appears quickly, and she repeats yesterday's chai order. Five minutes later, the dinner rush begins. The same screen now waits, spins, and finally returns an error.
Meera checks the application servers. CPU is comfortable. The load balancer is distributing traffic. More API instances are available. Yet requests that need order data keep slowing down. The database dashboard shows rising active connections, longer query time, and a growing line of transactions waiting for work.
The team calls the database tired. Aman stops them there. A database does not become tired in one vague way. It can scan too many rows, choose a poor join, wait on locks, read from slow storage, sort more data than memory can hold, open too many connections, or repeat a cheap query thousands of times.
Database performance work begins by replacing 'the database is slow' with one measured query, one execution path, and one constrained resource.
Aman chooses the order-history request because it is important, reproducibly slow, and narrow enough to trace. The goal is not to collect every optimization technique. It is to understand why this request became expensive and fix the reason without damaging correctness.
What Database Performance Actually Means
Database performance is the ability to complete useful reads and writes with acceptable latency, throughput, resource use, and predictability under the expected workload. Fast on an empty laptop is not the target. SnackNow needs stable behavior when many users read menus, create orders, update payments, and track deliveries at once.
A read-heavy catalogue, a write-heavy payment ledger, and an analytical dashboard stress different parts of a database. Performance is therefore a relationship among the query shape, data volume, indexes, schema, concurrency, hardware, configuration, and access pattern.
Signal | What it tells Aman | What it does not prove |
|---|---|---|
Query latency | How long a statement takes | Why it takes that long |
Query throughput | How much database work completes | Whether users receive useful results |
CPU | Compute pressure from parsing, joins, sorts, or functions | That adding CPU is the correct fix |
Disk I/O | Pages being read or written | Whether those pages were necessary |
Lock waits | Transactions are blocking each other | Which transaction design should change |
Active connections | How much concurrent database demand exists | That every connection is doing useful work |
How often requested pages are served from memory | That query plans and access patterns are healthy |
How to read this visual: connect each resource signal to the specific slow query and user request. A high number is a clue, not a diagnosis by itself.
A useful performance statement has a workload and a boundary: the P95 order-history request takes 2.4 seconds at 300 requests per second, and 1.8 seconds is spent in one SQL statement.
Measure Before You Tune
Aman starts at Riya's request and follows its trace into the database. He records the endpoint latency, the SQL fingerprint, call count, rows returned, rows examined where available, database duration, lock wait, and error. He compares the dinner rush with a quiet baseline.
Slow-query logs reveal statements that cross a duration threshold. Normalized query statistics group statements with different parameter values so one query shape cannot hide behind thousands of nearly identical strings. Application traces connect each SQL statement to the route and user action that created it.
He also checks the shape of load. Did one query become slower, or did the application begin issuing far more queries per request? Did a deployment change the predicate? Did the table grow enough for a formerly harmless scan to become expensive? Did connection wait time rise before execution even started?
Reproduce one slow user action and record its latency percentile.
Trace the request and identify every SQL statement it issues.
Rank query fingerprints by total time, average time, call count, and rows processed.
Inspect resource and wait signals during the same time window.
Capture the execution plan for the expensive statement.
Change one suspected cause, rerun the same workload, and compare the result.
The most expensive query is not always the slowest single query; a 10 ms query called 100,000 times can consume more capacity than a 2 second report called twice.
The Query Plan: How the Database Decides to Work
SnackNow's slow statement asks for recent completed orders from one restaurant, joins customer and payment data, sorts by creation time, and returns twenty rows. SQL describes the result. The query planner decides how to produce it.
An EXPLAIN plan shows operators such as sequential scans, index scans, joins, sorts, aggregates, and their estimated rows and costs. An execution plan with actual measurements shows what happened when the query ran: actual rows, loops, and time for each node. That difference matters because poor estimates can lead to poor choices.
Aman reads from the deepest operators upward. He looks for a scan that touches far more rows than it returns, a join executed many times, a sort that spills to disk, a filter applied after an expensive step, or a large gap between estimated and actual rows. He does not label every sequential scan bad; reading most of a small table may be cheaper than jumping through an index.
Plan clue | Likely meaning | Next check |
|---|---|---|
Many rows scanned, few returned | Access path is too broad | Predicate and candidate index |
Estimated rows far from actual | Statistics or data distribution misled planner | Statistics, skew, parameter behavior |
Nested operation loops many times | Repeated inner work | Join strategy, index, or N+1 source |
Sort spills to disk | Working set exceeded memory | Rows entering sort, order index, memory limit |
Long lock wait | Another transaction owns required resource | Blocking transaction and lock scope |
How to read this visual: find the operator where rows or time expand unexpectedly, then ask why that work was necessary. The plan is evidence about execution, not a score where every large number is automatically wrong.
Safety note: A plan with actual execution may run the query and its side effects. Use a safe environment or a read-only, carefully bounded statement when production risk exists.
Indexes: A Faster Route to Matching Rows
Without a useful access path, the database may inspect a large part of SnackNow's orders table to find one restaurant's latest completed orders. An index stores selected keys in a structure designed for faster lookup, with references to the matching table rows.
For this query, an index beginning with restaurant_id and status, followed by created_at in the useful order, may let the database jump near the matching rows and stop after the first twenty. The exact index depends on the real predicates, ordering, selectivity, database engine, and write cost. Aman confirms it with the plan instead of copying a generic index recipe.
Visual purpose: This visual helps you understand the difference between inspecting a whole order table and following a selective access path.
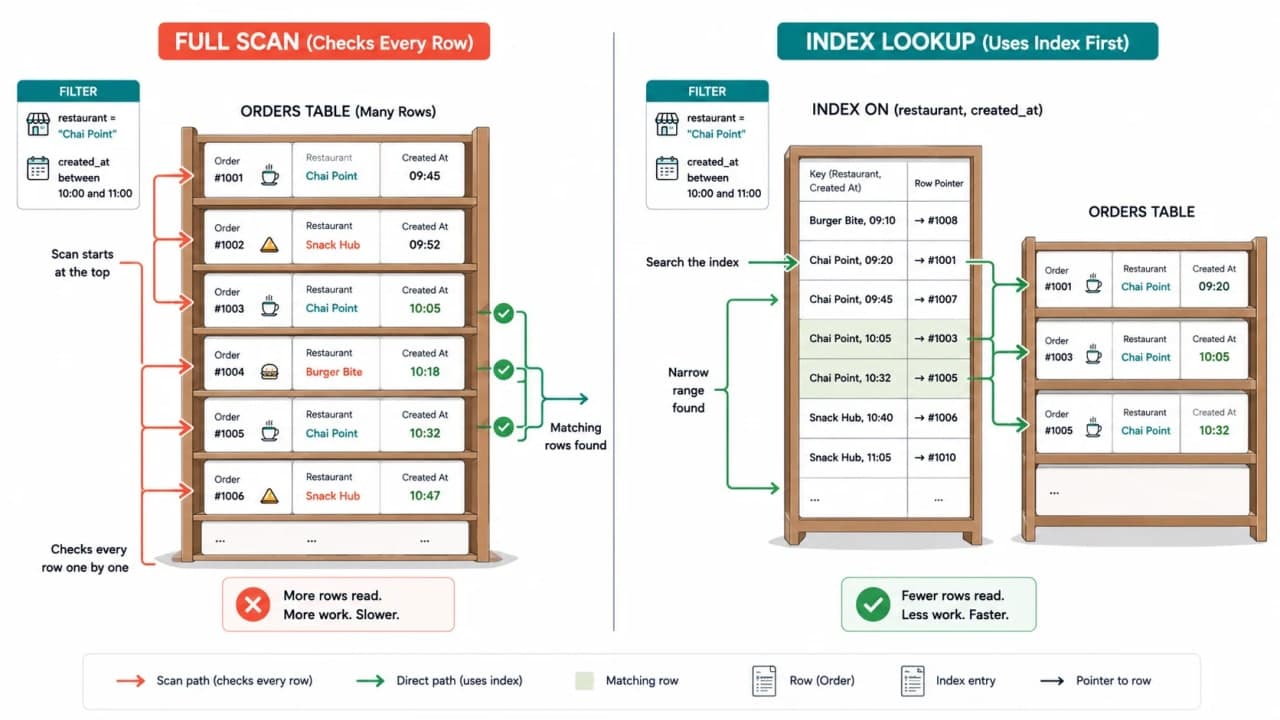
How to read this visual: the full-scan side touches every shelf before filtering. The indexed side narrows by the query's leading keys and reaches only a small ordered range.
Index family | Strong fit | SnackNow example | Important limit |
|---|---|---|---|
B-tree | Equality, range, and ordered access | Restaurant orders by created time | Column order and selectivity matter |
Hash | Equality lookup in engines that support it | Exact token or key lookup | Does not naturally serve ranges or ordering |
Full-text | Language-aware term search | Search restaurant descriptions | Different semantics from substring matching |
Bitmap-style | Combining low-cardinality filters in analytical systems | Status and city reporting filters | Usually unsuitable for high-contention transactional writes |
How to read this visual: choose by the operators the engine must support, not by the name that sounds fastest. Engine-specific implementations and limitations still apply.
A composite index is not a bag of columns. Its order determines which prefixes and ranges can be used efficiently. An index on restaurant_id, status, created_at may help a query filtering the first two and ordering by the third, while a query filtering only created_at may need a different path.
An index is a maintained copy of selected ordering information: it saves read work by adding storage and write work.
Why More Indexes Can Make SnackNow Worse
Every inserted order must update the table and each relevant index. Updates may change several index entries. Deletes must remove them. Index pages consume memory and storage, and redundant indexes make maintenance, backups, and planning more expensive.
Aman checks whether an index serves a real high-value query, whether an existing composite index already covers the prefix, how often the table is written, and whether the index remains selective as data changes. He monitors usage before removing an index because rare operational queries may still depend on it.
He also avoids enormous covering indexes by default. Including extra columns can reduce table lookups for a critical read, but the larger index increases write amplification and may no longer fit comfortably in memory. The query and workload must earn that cost.
Common mistake: Adding an index for every WHERE clause creates a faster demo and a slower production write path.
Rewrite the Work Before Buying More Capacity
The original order-history query selects every column even though the screen displays six. It applies a date function to created_at, making a simple range access harder. It sorts thousands of candidate rows before limiting the result. One join exists only to fetch a field that the response never uses.
Aman returns only required columns, expresses the date as a direct range, removes the unused join, and ensures filtering happens before expensive sorting and aggregation. He keeps parameters bound instead of constructing SQL strings, which supports safety and more stable statement handling.
Waste pattern | Why it costs | Safer direction |
|---|---|---|
SELECT every column | More I/O, memory, and network transfer | Request only response fields |
Function around indexed column | May prevent a direct index range | Transform the constant and use a range |
Unbounded result | Work and payload grow with table | Limit and paginate |
Repeated scalar lookup | Extra round trips and plan executions | Join or batch when semantics match |
Sort before selective filter | Large temporary working set | Filter early and align access path |
How to read this visual: reduce rows, columns, round trips, and expensive operators while preserving the exact business result. Then confirm the new plan and end-to-end latency.
The N+1 Query Problem
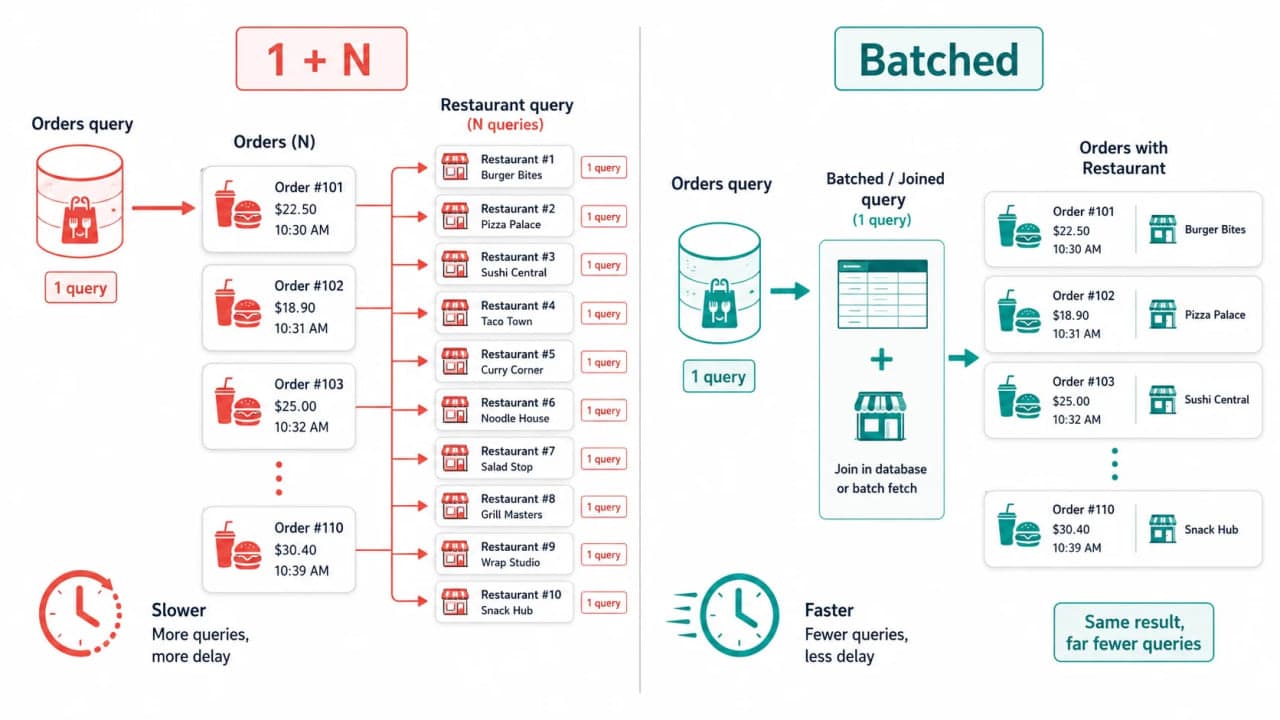
Aman's trace reveals a second problem. SnackNow fetches twenty orders with one query. Then the application loops over the results and fetches the restaurant once for each order. One page produces twenty-one queries. At one hundred orders, it produces one hundred and one.
Each restaurant lookup is fast in isolation, but every round trip crosses the application-database boundary, competes for a connection, parses or executes work, and returns data. Under load, these small waits multiply across users.
Visual purpose: This visual helps you understand how application code can multiply a simple page into one query plus one query per result.
How is it so far?
Vote with other readers
How to read this visual: the left fan-out repeats one lookup for every order. The right path batches restaurant IDs or joins the needed data so query count stays bounded as the page grows.
Aman can use a join, an ORM include or eager-load feature, or one batch query using the distinct restaurant IDs. A request-scoped data loader can combine repeated keys and reuse results. He chooses based on result size and ownership instead of forcing one giant join that duplicates huge child collections.
He verifies the fix with query count as well as query duration. A page that became faster in development can still regress when a new loop quietly adds another per-row lookup.
N+1 is an access-pattern bug: the database may execute every individual query efficiently while the application asks it to do far too many separate jobs.
Connection Pooling: Reuse a Bounded Set of Lines
Fixing the query helps, but SnackNow still opens a fresh database connection for many requests. Establishing a connection can involve network setup, authentication, encryption, and database process or memory overhead. During a burst, hundreds of application requests try to create connections together.
A connection pool keeps a bounded set of established connections and lends them to requests. When a request finishes its database work, the connection returns to the pool. Reuse removes repeated setup, while the bound prevents one application instance from opening connections without limit.
Visual purpose: This visual helps you understand why connection reuse and connection limits solve different parts of the same pressure problem.
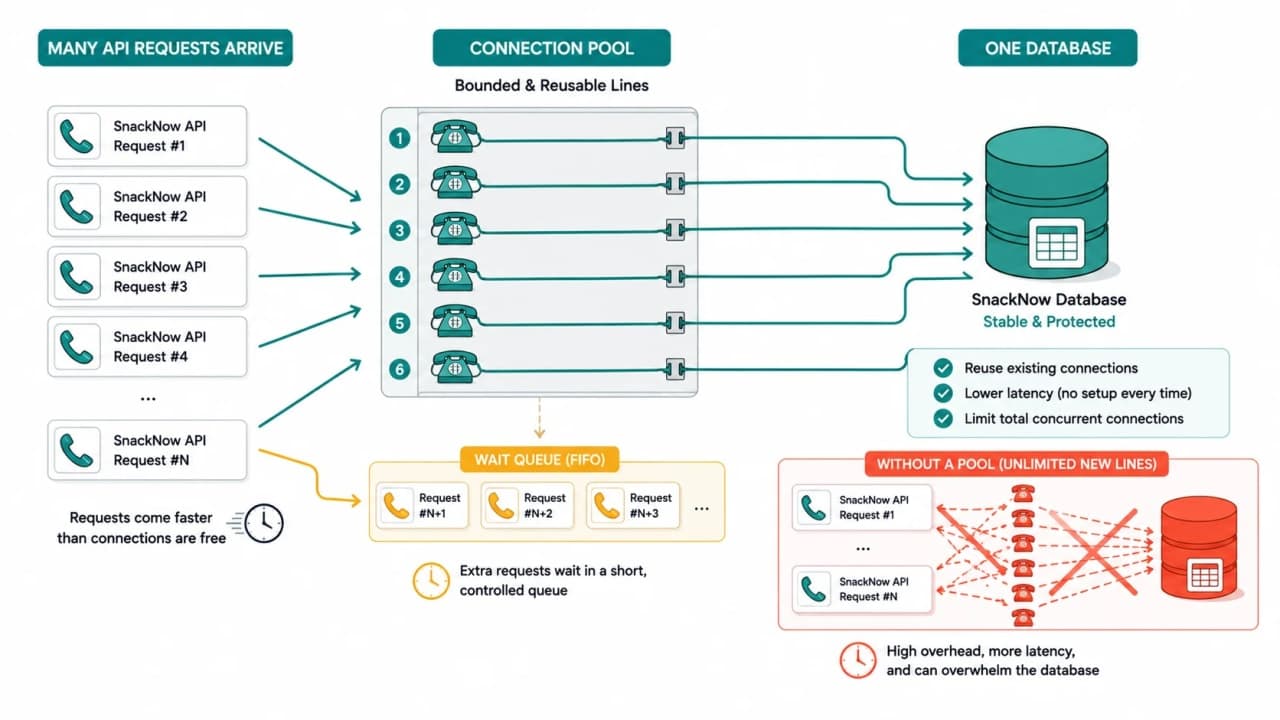
How to read this visual: many requests share a small set of database lines. When every line is busy, later requests wait in a controlled queue instead of creating unlimited connections.
Pool size must be planned across the fleet. Twenty connections per instance sounds modest until autoscaling creates fifty instances and the database receives one thousand potential connections. Aman reserves capacity for migrations, administration, background workers, and failover behavior rather than assigning the entire database limit to web requests.
A pool that is too small creates connection wait even when the database has headroom. A pool that is too large pushes the queue into the database, increases memory and scheduling pressure, and allows more concurrent queries than the storage path can handle. Aman measures pool wait, checkout duration, query time, timeouts, and total connections together.
A connection pool is a concurrency budget, not a machine for creating database capacity.
Short Transactions Keep Shared Work Moving
One SnackNow route starts a transaction, reads an order, calls a delivery provider over the network, and then updates the order. While the provider responds, the transaction and connection remain open. Depending on isolation and operations, locks or old row versions may also remain relevant.
Aman keeps the database transaction around the smallest atomic state change. External calls happen outside that lock-holding window where the business workflow allows it. When coordination spans systems, he uses explicit states, idempotency, and asynchronous follow-up rather than pretending one long database transaction can safely control the internet.
Acquire a connection only when database work is ready to begin.
Keep transactions focused on one required consistency boundary.
Avoid user interaction and slow network calls inside a transaction.
Use statement, lock, and transaction timeouts that fail safely.
Log the blocking and blocked statements when lock waits appear.
Return the connection on every success, error, timeout, and cancellation path.
Long transactions turn one slow operation into shared waiting because they retain scarce connections and may retain locks or versions other work needs.
Normalization and Denormalization Are Workload Choices
SnackNow's normalized schema stores restaurants, users, orders, and payments separately. That reduces accidental duplication and gives each fact a clear owner. An order refers to a restaurant instead of copying every restaurant field into every row.
Normalization supports correctness and focused writes, but some read paths need several joins. Denormalization deliberately duplicates or precomputes selected data so an important read performs less work. The price is a new consistency rule: when the source changes, how and when does the copy change?
Question | Normalized source | Denormalized read model |
|---|---|---|
Primary goal | Clear ownership and update integrity | Fast access for one known read pattern |
Read shape | May join related entities | Often fewer joins or calculations |
Write shape | Update fact in one place | Update or rebuild copies |
Freshness | Current within transaction rules | May be synchronous or intentionally delayed |
Best use | Transactional source of truth | Measured high-value repeated read |
How to read this visual: keep the authoritative fact normalized unless a proven read path earns duplication. For every copy, name its owner, refresh path, acceptable staleness, and repair strategy.
Aman does not flatten the whole SnackNow schema because joins appeared in one plan. He might copy the restaurant display name onto an immutable historical receipt, or build a separate dashboard projection. Those are explicit product semantics, not a blanket rejection of normalization.
Materialized Views and Precomputed Read Models
Meera's operations dashboard groups orders by city, restaurant, payment status, and fifteen-minute window. Recomputing months of history for every refresh is wasteful because most source rows have not changed.
A materialized view stores the result of a query so repeated reads can access precomputed rows. It must be refreshed, and refresh behavior differs by database and design. A custom summary table or event-fed projection can serve the same broad purpose with a refresh path the application controls.
This is useful when the calculation is expensive, reads are frequent, and some staleness is acceptable. It is dangerous when the UI implies real-time truth but the view updates every hour, or when nobody owns refresh failures.
Visual purpose: This visual helps you understand how transactional source tables can feed an intentionally refreshed read model and a bounded result page.
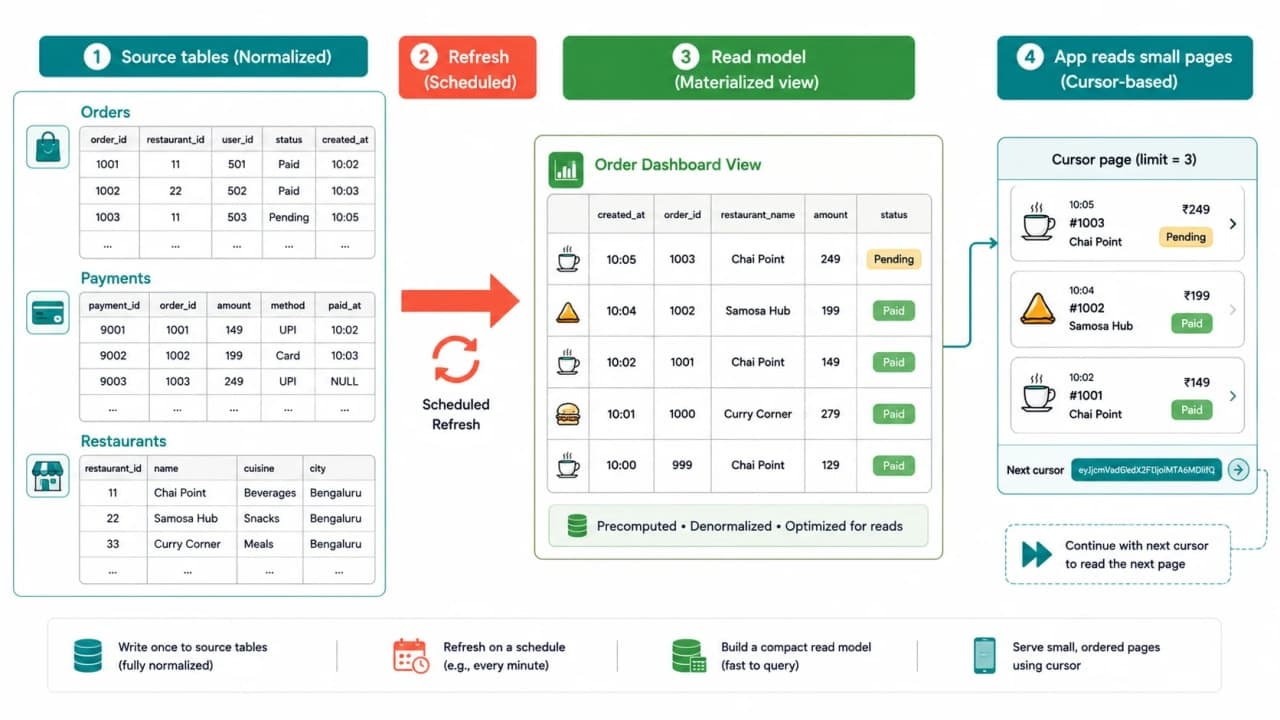
How to read this visual: source tables remain authoritative. A refresh step performs the expensive combination once, and many dashboard requests read the smaller result in ordered pages.
Precomputation moves work through time. It does not delete work, and it adds a freshness contract.
Batching and Pagination Bound the Work
The database cannot return ten million orders cheaply just because one query requests them. SnackNow limits interactive responses and lets users continue through stable pages. Batch jobs also process bounded groups, commit progress, and apply backpressure instead of loading the entire dataset into memory.
Offset pagination is simple: skip a number of rows and return the next page. It supports direct page numbers, but deep offsets may still require the database to walk or sort many earlier rows. Concurrent inserts can also shift items between pages.
Cursor pagination continues after a stable ordered key, such as created_at plus order_id to make the order unique. It is strong for feeds and sequential navigation because the next query can seek from the last seen position. It does not naturally jump to arbitrary page 713, and the cursor must encode a deterministic order.
Need | Offset pagination | Cursor pagination |
|---|---|---|
Simple numbered pages | Strong fit | Requires extra design |
Very deep result set | Can become expensive | Can seek from last key |
Rows inserted during browsing | Pages can shift | More stable with deterministic order |
Jump to arbitrary page | Easy | Not its natural strength |
Required ordering | Consistent order still important | Unique stable order is essential |
How to read this visual: choose from the product navigation requirement and dataset behavior. In both models, limit page size and align filters and ordering with an efficient access path.
When Bigger Architecture Is Actually Needed
After the query, index, access pattern, transaction, and pool fixes, SnackNow may still outgrow one database. Read replicas can move suitable read traffic, but they add replication lag and do not repair an inefficient query. Partitioning can prune data when queries include the partition key, but poor predicates may still touch every partition.
Sharding spreads data and writes across database nodes, but introduces routing, cross-shard operations, rebalancing, and distributed consistency decisions. More hardware can buy valuable headroom, yet it may only make waste more expensive if the workload remains unbounded.
Observed limit | Possible response | Question before using it |
|---|---|---|
Read capacity on primary | Read replica | Can these reads tolerate lag and route correctly? |
One huge time-based table | Partitioning | Do important queries include a pruning key? |
Write or storage limit of one node | Sharding | Is the shard key balanced and are cross-shard operations acceptable? |
Temporary resource ceiling | Larger instance | Did measurements prove CPU, memory, or I/O is the constraint? |
How to read this visual: match a measured physical limit to an architectural response. None of these choices replaces query and access-pattern discipline.
Scale-out is appropriate when efficient work exceeds one node's safe capacity, not when inefficient work has merely become visible.
Aman's Repeatable Database Debugging Workflow
Visual purpose: This visual helps you understand a practical sequence that moves from user symptom to verified improvement without random tuning.
Step | Action | Evidence to keep |
|---|---|---|
1. Define | Choose one slow user action and percentile | Endpoint, load, P50/P95/P99, error rate |
2. Trace | Map request to SQL fingerprints | Query count and database time per request |
3. Rank | Find high total-cost statements | Calls, mean time, total time, rows |
4. Explain | Inspect plan and actual behavior safely | Scans, joins, estimates, loops, spills, waits |
5. Change | Fix one query, index, batch, or boundary | Migration or code change and rollback |
6. Re-test | Repeat comparable workload | Before-and-after latency and resource use |
7. Guard | Add monitoring and regression protection | Slow-query alert, query-count test, capacity threshold |
How to read this visual: do not skip from symptom to change. Each step narrows uncertainty, and the final guard prevents the same access pattern from returning quietly.
Interview-ready answer: I optimize the database by measuring the request, finding the dominant query or wait, reading the execution plan, reducing unnecessary work, and verifying the result under representative load before considering larger topology changes.
Common Database Performance Mistakes
Adding indexes without reading the plan
The new index does not match the predicate or ordering, duplicates another index, or costs more writes without being selected.
Optimizing only the slowest statement
A frequent small query or N+1 loop consumes more total time and connections than the obvious report.
Making the pool enormous
The application removes its local wait by sending too much concurrent work into a database that has finite CPU, memory, and I/O.
Holding transactions across network calls
Connections and locks remain occupied while an unrelated provider decides when to respond.
Denormalizing without an owner
Duplicated fields drift because the refresh, repair, and acceptable-staleness rules were never defined.
Returning unbounded data
One export-shaped request consumes memory, network, sort, and connection time intended for ordinary traffic.
Scaling before removing waste
A replica or shard multiplies operational complexity while the same inefficient access pattern continues on more machines.
Benchmarking with unrealistic data
A query looks perfect on ten thousand uniform rows and fails on production-scale, skewed data with real concurrency.
Final Database Performance Cheat Sheet
Visual purpose: This visual helps you understand the smallest complete set of concepts needed to diagnose and explain a database performance problem.
Concept | Simple meaning | SnackNow use | Watch out for |
|---|---|---|---|
Slow-query evidence | Which statements consume time | Find costly order-history shape | Thresholds without call count |
Query plan | How the engine executes | Locate broad scan or repeated join | Treating estimates as actual truth |
Index | Maintained faster access path | Seek recent restaurant orders | Write and storage cost |
N+1 | One query per returned item | Repeated restaurant lookup | Fast individual queries hide multiplication |
Connection pool | Bounded reusable connections | Share database lines | Fleet-wide total exceeds capacity |
Short transaction | Small atomic database window | Update order state | Locks held during external I/O |
Denormalized read model | Deliberate copied or computed data | Operations dashboard | Freshness and repair ownership |
Cursor pagination | Continue after stable ordered key | Deep order feed | Non-unique or changing cursor |
Replica or shard | More topology capacity | Growth beyond one efficient node | Lag and distributed complexity |
How to read this visual: start with evidence, reduce work at the query and access-pattern level, bound concurrency and result size, then add precomputation or topology only for a named remaining limit.
The Mental Model Riya Can Finally Use
Riya does not need to know which join algorithm SnackNow chose. She needs the order page to respond predictably. Aman gets there by treating the database as an execution system whose work can be observed, explained, and bounded.
He finds the exact request, counts its queries, studies the expensive plan, gives the engine a selective path, removes repeated round trips, limits result size, and protects connections. For repeated expensive reads, he builds an owned read model with an honest freshness rule.
Only when efficient work reaches the safe limit of one node does he reach for replicas, partitions, larger hardware, or shards. By then he can name the bottleneck those tools are meant to remove.
The durable optimization loop is simple: measure the work, explain the plan, remove waste, bound demand, and prove the improvement.
Lock in the takeaway
Frequently asked questions
What is the first step in database performance optimization?
Measure the user-visible symptom and trace it to specific database work before changing anything. Use request latency, slow-query logs, normalized query statistics, query plans, lock waits, connection pressure, CPU, memory, and disk signals to identify the real constraint.
How does an index improve database performance?
An index gives the database an ordered or specialized access path so it can locate matching rows without scanning the entire table. It can speed reads, filters, joins, and ordering, but consumes storage and adds work to inserts, updates, and deletes.
What does an EXPLAIN query plan show?
A query plan shows how the database intends to execute a query, including scans, joins, sorts, estimated rows, and costs. An execution plan with actual measurements can reveal where estimates differ from reality, but it should be used carefully because the query may really run.
What is the N+1 query problem?
The N+1 problem happens when an application runs one query to fetch a list and then one additional query for each item. It creates many round trips and repeated work. A join, eager load, batch query, or data-loader pattern often replaces it with bounded queries.
Why use a database connection pool?
A connection pool reuses a bounded set of established database connections instead of opening one for every request. It reduces setup overhead and protects the database, but the pool must be sized across all application instances so total connections remain safe.
When should a database be denormalized?
Denormalize after a measured read path is too expensive and the team can define how duplicated data stays correct. Keep normalized source-of-truth data when possible, then add a deliberate read model, summary, or duplicated field for a proven access pattern.
What is the difference between offset and cursor pagination?
Offset pagination skips a number of rows and is simple for page numbers, but deep pages can become expensive and results can shift during writes. Cursor pagination continues after a stable ordered key, making large sequential result sets more predictable when the ordering is unique.