
Listen to this article
Checking audio support
SnackNow Is Slow, But 'Slow' Is Not Enough
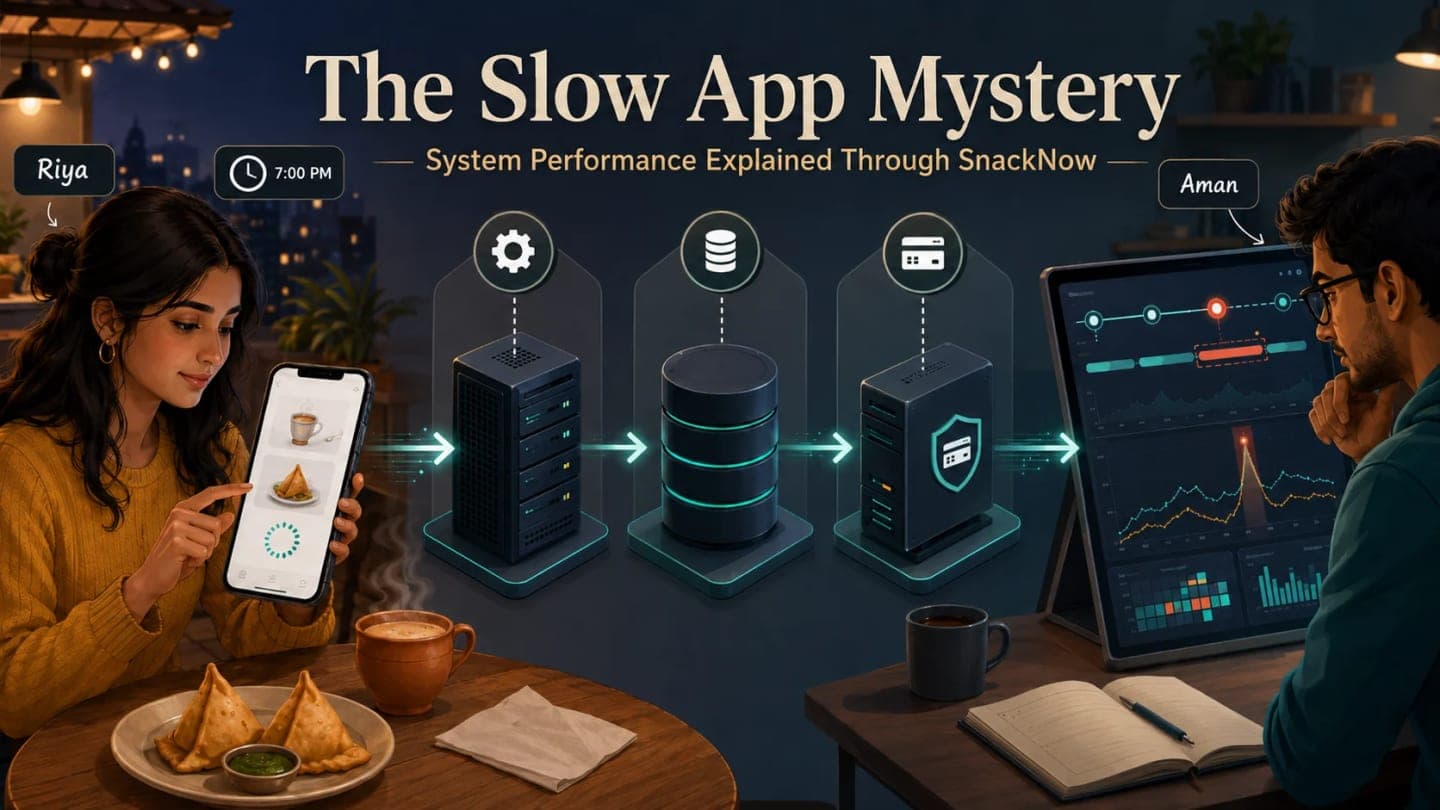
At 7 PM, Riya opens SnackNow with a very ordinary plan: masala chai, two samosas, and no unnecessary drama. The menu appears after a pause. Add to Cart spins. The payment page takes long enough for her to wonder whether tapping again will charge her twice.
The strange part is inconsistency. One screen opens quickly, another hangs. A retry sometimes works. Her friend orders at the same time and finishes before her. From Riya's side, the diagnosis is simple: the app is slow.
Meera, who runs SnackNow, sees complaints arriving and asks Aman to make the app fast before the dinner rush gets worse. Aman does not open the cloud console and start adding servers. He asks a more useful question: which action is slow, for whom, under what load, and where is the time going?
Aman: 'Slow is not a diagnosis. It is a symptom we must turn into measurements.'
System performance is how efficiently a system completes useful work under a particular load. Speed matters, but performance also includes capacity, consistency of response, error rate, and the resources consumed to produce that result. A request that returns in 100 milliseconds while one user is online tells us almost nothing about what happens when ten thousand users arrive.
A useful performance conversation always names the operation, the load, the metric, and the acceptable target.
Visual purpose: This visual helps you understand how one user-visible delay can be distributed across the complete request path.
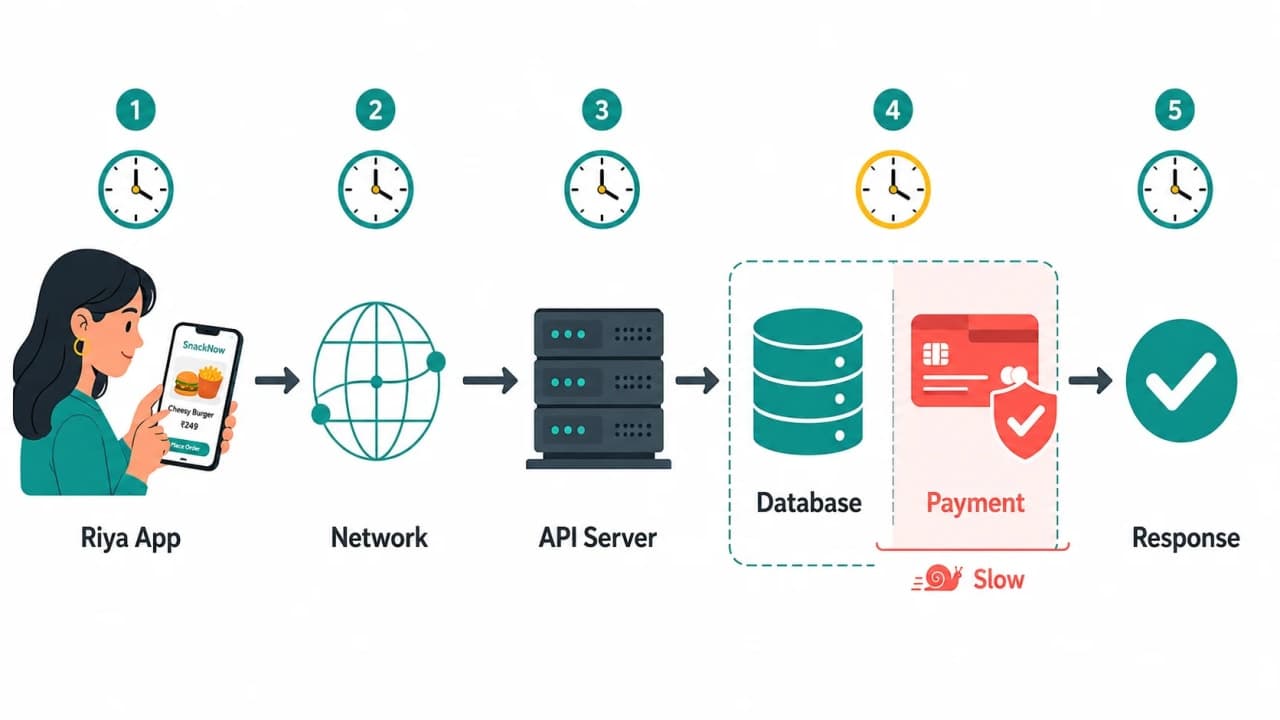
How to read this visual: follow the request from Riya's phone to the API, database, payment service, and back. The total wait is made of several smaller waits, so Aman must isolate the slow stage instead of blaming the whole app.
Checkpoint: 'The app is slow' becomes actionable only after Aman identifies a specific journey such as menu load, cart update, or payment confirmation.
Latency: How Long Riya Waits
Aman starts with latency because Riya is waiting for individual actions. Latency is the elapsed time between starting an operation and receiving its result. For a menu request, the clock starts when the app sends the request and stops when the useful response reaches the app.
That end-to-end number can contain network travel, time waiting for an available server worker, application logic, database queries, calls to other services, serialization, and the return trip. If payment confirmation takes 4 seconds, saying 'the API took 4 seconds' is only a summary. A trace may reveal that SnackNow itself used 120 milliseconds while the payment provider consumed 3.6 seconds.
Latency is not one universal number. A menu read, cart write, image download, and payment authorization have different work and different acceptable targets.
A fast menu request might finish in a few hundred milliseconds, while a payment authorization may reasonably take longer because it crosses a secure third-party boundary. Aman should not copy one threshold onto every endpoint. He should define performance around the user's task.
SnackNow action | What the clock includes | What a bad result feels like |
|---|---|---|
Load menu | Network, API, cache or database read, response | Blank or late menu |
Update cart | Validation, price lookup, cart write | Spinner after every tap |
Authorize payment | SnackNow plus payment-provider round trip | Fear of duplicate payment |
Open order history | Authentication, query, joins, pagination | Old orders appear too slowly |
Takeaway: latency should be measured around a named user action, then decomposed into the stages that created it.
For Riya, performance begins with waiting time. For Aman, that waiting time becomes a path he can measure.
Throughput: How Many Orders SnackNow Can Handle
While Riya cares about one order, Meera cares about the entire 7 PM rush. Throughput measures how much useful work the system completes in a period: requests per second, orders per minute, messages processed per second, or megabytes transformed per hour.
Suppose SnackNow completes 20 orders per second with a P95 checkout latency below one second. If traffic rises and it still accepts 200 requests per second but completes only 12 orders per second, raw incoming traffic is not success. The meaningful throughput is completed business work.
Latency and throughput influence each other, but they are not opposites on one switch. Batching can raise throughput while making an individual item wait longer for the batch. Adding concurrency may raise throughput until CPU, database connections, or a downstream dependency saturates. Beyond that point, requests queue up and latency climbs sharply.
Visual purpose: This visual helps you understand the difference between timing one order and counting completed orders across the whole service.
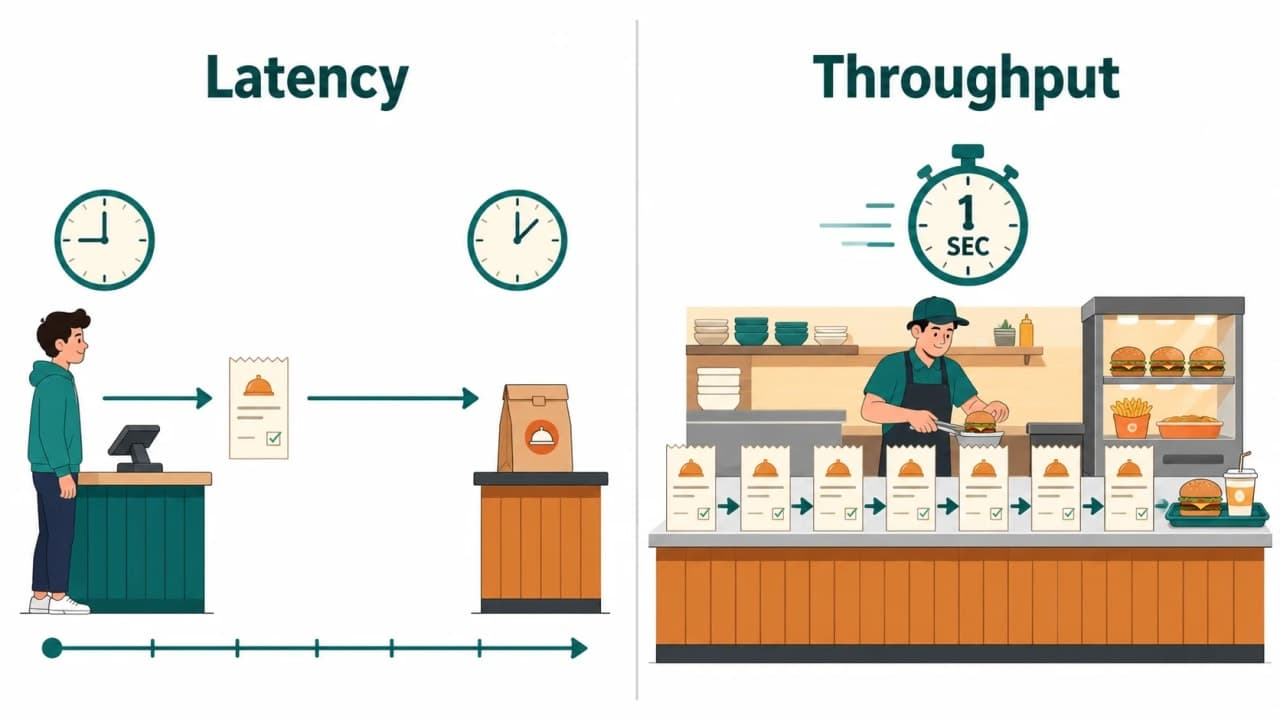
How to read this visual: the left side follows one request from start to finish, which is latency. The right side counts every completed order during a time window, which is throughput. A healthy system needs targets for both.
Interview-ready answer: Latency measures the duration of one operation. Throughput measures the rate of completed work. Optimizing one does not automatically optimize the other.
Why Fast for One User Is Not the Same as Scalable
Aman's laptop test is wonderfully fast. Ten test users browse the menu, and every request returns quickly. At 7 PM, ten thousand real users arrive, connections pile up, the database pool fills, and the payment service begins timing out. The code did not suddenly forget how to run. The operating conditions changed.
Responsiveness describes how quickly the system reacts. Scalability describes whether the system can handle increased load without unacceptable degradation. A service can be responsive at low load but fail to scale. It can also scale to accept more work while delivering a poor user experience because latency is already too high.
Horizontal scaling adds more service instances. Vertical scaling gives an instance more CPU or memory. Both can help when the constrained resource is in that layer. Neither fixes a slow query, a serialized lock, a strict third-party rate limit, or a database connection pool that cannot grow safely.
Observed behavior | Responsive? | Scalable? | What Aman learns |
|---|---|---|---|
Fast at 10 users, collapses at 10,000 | At low load | No | Capacity limit appears under load |
Slow at 10 and slow at 10,000 | No | Unknown | Fix the basic request path before scaling |
Fast at 10 and stays acceptable at 10,000 | Yes | Yes for tested range | Current design meets the measured load |
Handles 10,000 but P99 is terrible | Not consistently | Capacity grew, experience did not | Tail latency needs attention |
Takeaway: scalability is always bounded by a workload and an acceptable performance target. 'It scales' without those two details is marketing, not engineering.
The Average Is Lying: P50, P95, and P99
Aman checks the dashboard and sees an average checkout latency of 320 milliseconds. That sounds healthy. Riya is still staring at a spinner for nearly five seconds. Both observations can be true.
Imagine 100 checkout requests. Most finish between 150 and 300 milliseconds, but a few wait on a slow payment response and take several seconds. Those slow requests barely move the average when the fast requests are numerous. Percentiles show the shape of the experience instead of compressing it into one number.
P50 is the median: half of requests are faster and half are slower. It represents a typical request.
P95 is the value under which 95% of requests finish. The remaining 5% are slower.
P99 is the value under which 99% of requests finish. The remaining 1% form a severe tail worth investigating.
If SnackNow reports P50 at 180 ms, P95 at 1.1 s, and P99 at 4.8 s, the system is not simply '180 ms fast.' It has a long tail. Riya may be one of the users living there, especially when her request touches a slower restaurant, region, database shard, or payment route.
Visual purpose: This visual helps you understand how a small number of very slow requests can disappear inside a healthy-looking average.
How is it so far?
Vote with other readers
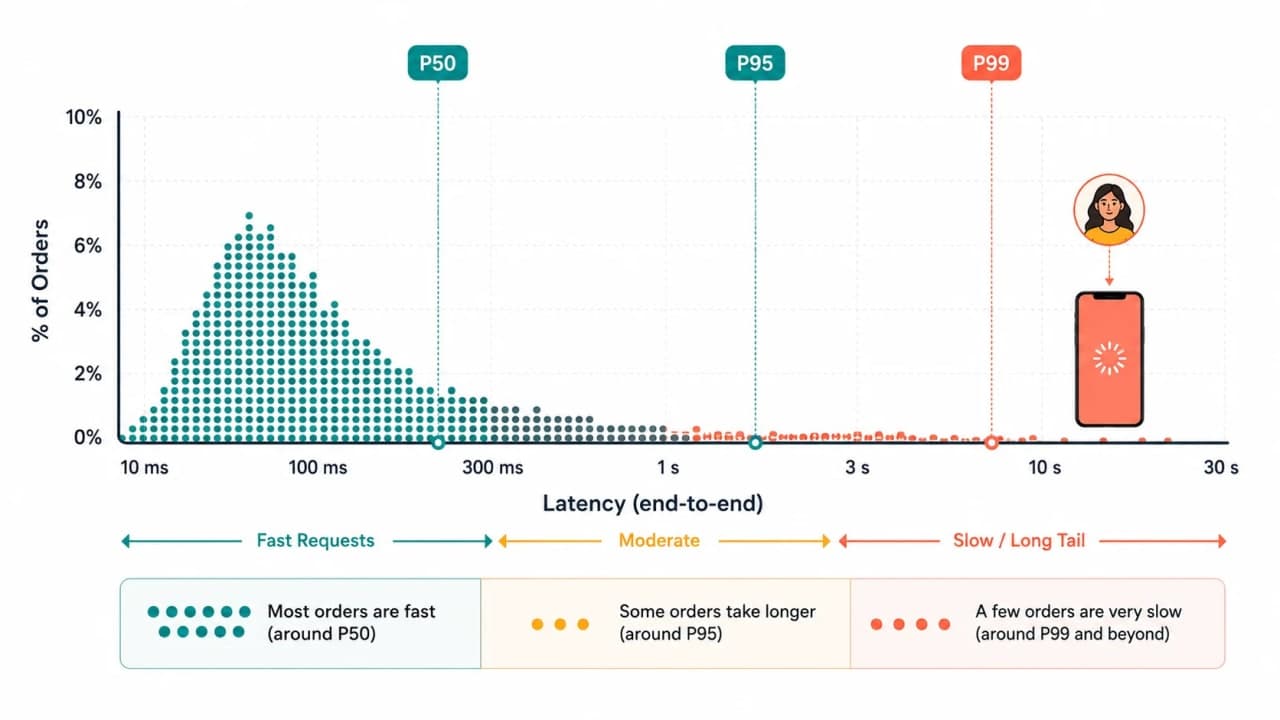
How to read this visual: most order dots sit in the fast cluster. Move right toward P95 and P99 to see the thin tail. The tail contains fewer requests, but each one belongs to a real user who experiences the system as slow.
An average describes arithmetic. A percentile describes how waiting time is distributed across users.
Common mistake: P99 is not the maximum. It is the threshold below which 99% of measured requests completed during the chosen time window.
SLA, SLO, and SLI: Promise, Target, Measurement
Meera now asks a business question: how fast should SnackNow promise to be? Aman needs three related terms, but he introduces them in the order the system actually uses them.
First comes the SLI, or service level indicator. It is a carefully defined measurement, such as the proportion of menu requests that complete successfully within 500 milliseconds over 28 days. 'Latency' alone is not a complete SLI; the operation, threshold, population, and measurement window matter.
Next comes the SLO, or service level objective. This is the internal target for the SLI. SnackNow might aim for 99% of eligible menu requests to complete within 500 milliseconds over 28 days. The SLO gives engineers a shared boundary for alerts, testing, and tradeoffs.
Finally comes the SLA, or service level agreement. It is an external commitment to customers or partners and usually explains what happens if the commitment is missed. A company may keep its internal SLO stricter than its external SLA so the team has room to react before the contractual boundary is crossed.
Visual purpose: This visual helps you understand the order from actual measurement to internal target to external promise.
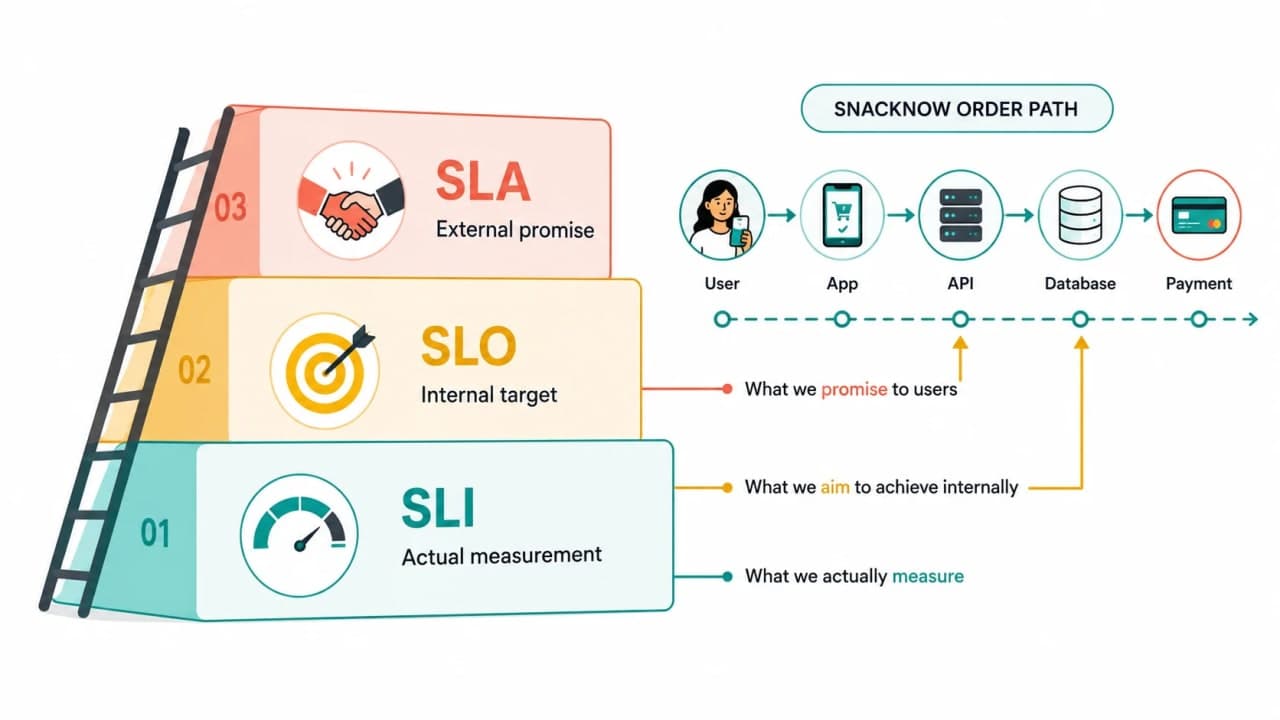
How to read this visual: start at the bottom. SnackNow measures an SLI, sets an SLO against that measurement, and only then makes an SLA commitment. Reversing this order creates promises the team may not know how to observe.
Term | Plain meaning | Illustrative SnackNow example | Owner's question |
|---|---|---|---|
SLI | Actual measurement | 98.7% of menu requests were under 500 ms | What happened? |
SLO | Internal target | 99% should be under 500 ms over 28 days | What do we aim for? |
SLA | External commitment | A partner-facing promise with defined remedies | What have we promised? |
Takeaway: a promise without an indicator cannot be proven, and an indicator without a target cannot tell the team whether performance is acceptable.
Testing Before the Fire: Load, Stress, Spike, and Endurance
Aman does not want to learn every limit from angry customers. He builds a realistic SnackNow journey - browse menu, add items, checkout, and check order status - then applies different traffic shapes. The same script can answer very different questions depending on how load is applied.
Visual purpose: This visual helps you understand which performance test to choose for a specific risk instead of treating every high-traffic run as a load test.
Test type | Traffic shape | Question it answers | SnackNow scenario |
|---|---|---|---|
Load | Expected normal or peak load | Does the system meet targets under planned demand? | A normal 7 PM dinner rush |
Stress | Rises beyond expected capacity | Where does performance degrade or break? | Increase orders until checkout misses its SLO |
Spike | Sudden sharp jump | Can the system absorb an abrupt burst? | A viral coupon sends traffic in one minute |
Endurance | Sustained load for hours | Do leaks, pool exhaustion, or slow degradation appear? | Dinner-level traffic runs through the night |
How to read this visual: choose the row by the failure you want to expose. Load validates expected behavior, stress finds limits, spike tests sudden change, and endurance reveals problems that need time to accumulate.
Tools such as k6, JMeter, or Locust can generate workloads, but the tool is not the test design. Aman must model realistic user paths, data, arrival rates, think time, and success criteria. A test that hammers one easy endpoint may produce impressive request counts while missing the checkout bottleneck entirely.
He also watches the load generator. If the machine producing traffic reaches 100% CPU or saturates its own network, the test may measure the generator's limit instead of SnackNow's limit.
Testing is a controlled rehearsal. Its value comes from the question, workload model, and acceptance threshold, not from the size of the final number.
Monitoring After Launch: The Dashboard Aman Watches
Testing tells Aman what happened during a planned experiment. Monitoring tells him what is happening continuously in the real system. The two support each other, but they are not substitutes.
Aman's dashboard begins with user-facing signals: request rate, latency percentiles, error rate, and saturation. He then connects those symptoms to logs and traces. Metrics show that P99 rose. Logs show repeated payment timeouts. A distributed trace shows that 3.6 seconds were spent in the payment span while the SnackNow application used only a small fraction of the total.
Visual purpose: This visual helps you understand how metrics, logs, and traces answer different parts of the same performance investigation.
Signal | Question it answers | Useful view | Tool family examples |
|---|---|---|---|
Metrics | Is behavior changing across time? | RPS, P95/P99, errors, CPU, memory | Prometheus + Grafana, CloudWatch |
Logs | What event or error occurred? | Structured entries by request or service | ELK, CloudWatch Logs |
Traces/APM | Where did one request spend time? | Spans across services and dependencies | Datadog, New Relic, OpenTelemetry APM |
Real user monitoring | What did browsers and devices experience? | Client load and interaction timing | RUM-capable observability tools |
How to read this visual: begin with the user symptom in metrics, use traces to locate the slow span, then use logs and resource metrics to explain why that span became slow. No single dashboard panel tells the whole story.
Testing creates controlled evidence before failure; monitoring preserves evidence while real traffic is happening.
Aman chooses signals first and tools second. New Relic and Datadog provide integrated APM experiences. Prometheus and Grafana are strong for time-series metrics and dashboards. ELK centralizes searchable logs. AWS CloudWatch collects cloud-native metrics and logs. The correct stack is the one that lets the team move from symptom to cause quickly and affordably.
Bottleneck Hunting: Where Is the Slow Counter?
A bottleneck is the stage that currently limits the system's useful performance under a given workload. In Meera's shop, one narrow packing counter can slow every completed order even when the kitchen has spare capacity. In SnackNow, the narrow counter might be CPU, memory pressure, a database query, a connection pool, network latency, a third-party API, a synchronized lock, or a growing queue.
The word currently matters. After Aman fixes a database query, the payment provider may become the next limit. Performance tuning moves the constraint; it does not grant permanent immunity from bottlenecks.
Visual purpose: This visual helps you understand a repeatable investigation order that prevents random scaling and random optimization.
Investigation step | What Aman checks | Evidence that moves him forward |
|---|---|---|
1. Name the symptom | Menu P95, checkout P99, errors, or throughput | One measurable failing user journey |
2. Reproduce under known load | Same path, data, and arrival rate | The symptom appears consistently |
3. Trace the request | Time spent in every service and dependency | One or more slow spans |
4. Correlate resources | CPU, memory, disk, network, DB, pools, queue depth | A saturated or waiting resource matches the slow span |
5. Change one constraint | Query, capacity, timeout, batching, or dependency behavior | A controlled hypothesis is tested |
6. Run the same test again | Latency, throughput, errors, and cost | Improvement without a hidden regression |
How to read this visual: move downward only when the previous step produced evidence. If Aman cannot reproduce the symptom or identify a slow span, adding infrastructure is still a guess.
Start at the user-visible SLI that is failing.
Break the path into network, application, database, cache, queue, and third-party time.
Check whether a resource is busy or requests are waiting for access to it.
Form one hypothesis and change one thing.
Compare the same workload before and after, including cost and error behavior.
Interview-ready answer: I identify bottlenecks by combining load reproduction, latency percentiles, distributed traces, resource saturation, database and dependency metrics, and a controlled before-and-after test.
Common Mistakes That Keep the Mystery Alive
Looking only at average latency
The average can stay calm while P99 users wait several seconds. Track median and tail percentiles for important journeys.
Confusing latency and throughput
A system can process many requests per second while individual requests wait too long, or respond quickly at a throughput that is too low for demand.
Scaling before measuring
Extra application servers do not repair a slow database query or an external API limit. Scale the constrained layer after evidence identifies it.
Ignoring P95 and P99
Tail users often exercise the most complex data, slowest regions, coldest caches, or most delayed dependencies. They are not statistical leftovers.
Testing only after production breaks
A repeatable baseline test should exist before a major campaign or architectural change, not after customers discover the limit.
Treating monitoring and testing as the same thing
Monitoring observes real behavior over time. Testing applies a controlled workload. Aman needs both to understand design limits and production reality.
Final Performance Cheat Sheet
Visual purpose: This visual helps you understand the smallest set of performance concepts worth carrying into an interview or design discussion.
Concept | Simple meaning | SnackNow hook | Use when | Common mistake |
|---|---|---|---|---|
Latency | Time for one operation | Riya waits for payment | Judging responsiveness | Using one target for every endpoint |
Throughput | Useful work per time | Orders completed per second | Planning capacity | Counting incoming traffic as completed work |
Responsiveness | How quickly users get a result | Cart reacts after a tap | Protecting user experience | Assuming scale guarantees speed |
Scalability | Behavior as load grows | Dinner rush increases | Planning growth | Saying scalable without a tested load |
P50 | Typical request boundary | Normal checkout | Understanding median behavior | Calling it the average |
P95/P99 | Slow-tail boundaries | Riya waits much longer | Finding hidden pain | Treating P99 as the maximum |
SLI | Actual service measurement | Measured fast-menu ratio | Observing service level | Naming a metric without definition |
SLO | Internal target | 99% under a threshold | Setting engineering goals | Choosing an arbitrary perfect target |
SLA | External commitment | Partner promise with remedies | Commercial assurance | Promising before measurement exists |
Bottleneck | Current limiting stage | One narrow counter | Prioritizing fixes | Assuming it never moves |
How to read this visual: start with the symptom row, connect it to a measurable metric, then use testing and monitoring to locate the limiting stage. The table is a reasoning sequence, not a vocabulary list.
The Mental Model Aman Keeps
Riya never asks for a percentile chart. She asks SnackNow to accept her order without making her wonder whether the tap worked. Meera never asks for a distributed trace. She asks why customers leave during the busiest hour. Metrics matter because they translate those human problems into engineering decisions.
Aman now has a repeatable path: name the user journey, measure latency and useful throughput, inspect the distribution instead of trusting the average, define the service target, test realistic traffic shapes, monitor production continuously, and follow evidence to the bottleneck.
Only after that diagnosis should he choose a remedy. The answer might involve faster data access, less repeated work, asynchronous processing, better concurrency, or a database change. Those are solutions to measured problems, not decorations for an architecture diagram.
Performance is not the art of making every number smaller. It is the discipline of keeping important user journeys inside clear, measured boundaries as real load changes.
Lock in the takeaway
Frequently asked questions
What is system performance in system design?
System performance describes how quickly, consistently, and efficiently a system handles useful work under a given load. It includes latency, throughput, error rate, resource use, and behavior as traffic grows.
What is the difference between latency and throughput?
Latency is the time one request takes. Throughput is the amount of work completed in a period, such as requests or orders per second. A system can be strong in one metric and weak in the other.
Why are P95 and P99 better than average latency alone?
Averages can hide a smaller group of very slow requests. P95 and P99 reveal tail latency, helping teams see the experience of users who wait much longer than the typical user.
How do SLI, SLO, and SLA differ?
An SLI is the measured service indicator, an SLO is the internal target for that indicator, and an SLA is an external commitment that may include remedies when the commitment is missed.
What is the difference between performance testing and monitoring?
Testing applies controlled workloads to learn how a system behaves before or during a planned test. Monitoring continuously observes real systems and alerts teams when production behavior moves outside expected limits.
How do you find a performance bottleneck?
Start with a measurable symptom, trace the request path, compare latency across stages, correlate it with CPU, memory, disk, network, database, and dependency signals, then change one suspected constraint and retest.
Can a scalable system still feel slow?
Yes. Scalability is the ability to handle increasing load without unacceptable degradation, while responsiveness is how quickly users receive results. A system may accept more traffic yet still have poor latency.